

React Native Debugging Needs a Timeline, Not More Tabs
Most React Native debugging setups do not suffer from a lack of tools. They suffer from a lack of continuity.
The console shows messages. A network inspector shows requests. Redux tooling shows actions. Navigation tooling shows screens. A profiler shows expensive work. A debugger can pause on a line of TypeScript. Each view is useful, but a production-shaped bug rarely stays inside one of them.
A customer taps Pay, the app changes state, navigation briefly redirects, a request starts, a retry fires, and an error boundary renders a fallback. If I inspect those facts in separate tabs, I have to reconstruct their order from memory. That reconstruction is often harder than the code change that fixes the bug.
This is why I think React Native debugging needs a timeline, not another isolated inspector.
The real unit of debugging is a sequence
Section titled “The real unit of debugging is a sequence”Bug reports usually arrive as outcomes:
- “Checkout sometimes fails.”
- “The next screen flashes and disappears.”
- “The app becomes slow after refreshing.”
- “The error message is wrong.”
An outcome tells me where someone noticed a problem. It does not tell me where the problem began. The cause may be several events earlier and in a different subsystem.
Consider a simplified checkout:
10:14:03.082 navigation.focus Checkout10:14:05.311 redux.action checkout/submitted10:14:05.337 network.request POST /orders10:14:05.901 network.request POST /orders → 40110:14:05.914 redux.action auth/refreshRequested10:14:06.442 network.request POST /token → timeout10:14:06.457 error.manual Unable to complete checkoutThe final message may look like a checkout problem. The sequence says something more precise: an expired session triggered a refresh, and the refresh timed out. That distinction changes which code I inspect, which condition I reproduce, and which behavior I test after the fix.
A timeline makes sequence the primary object. Inspectors still matter, but they become ways to examine an event rather than disconnected places where evidence lives.
Timestamps help, but relationships help more
Section titled “Timestamps help, but relationships help more”Putting events in chronological order is the first step. It is not the whole solution.
Two requests can overlap. Background refreshes can fire while a user is navigating. Fast Refresh can reconnect a development session. A log next to an error may be related, or it may be noise from an unrelated component.
Strong debugging context comes from explicit relationships:
- A
correlationIdcan connect work that belongs to one operation. - A
parentIdcan say that a handled error came from a failed request. - Route context can show which screen was active when an event occurred.
- A session identifier can prevent events from separate runs being mixed together.
- Monotonic sequence numbers can preserve ordering when device clocks are imperfect.
Time proximity remains useful, especially for systems that cannot provide stronger metadata. But I prefer explicit relationships whenever an integration can supply them. “These events happened together” is weaker than “this action caused this request.”
Context changes the questions I ask
Section titled “Context changes the questions I ask”When I debug from a console error alone, my first question is usually “Where was this thrown?” That is necessary, but narrow.
When I can see the surrounding story, I can ask better questions:
- What did the user or application do immediately before the symptom?
- Which state transition represented that intent?
- What external work started as a result?
- Did the failure originate in transport, application logic, or rendering?
- Was this the first failure, or only the first one that became visible?
Those questions produce hypotheses that span boundaries. A failed request might be caused by an incorrect token selected from state. A render loop might start after navigation restores a screen. An error boundary might hide the earlier warning that explains the invalid data.
The goal is not to collect everything. It is to preserve enough structured context to test a hypothesis without repeatedly reproducing the same bug.
A practical timeline workflow
Section titled “A practical timeline workflow”You can use this workflow even if your current tools do not provide a unified view.
1. Start from the visible symptom
Section titled “1. Start from the visible symptom”Find the error, unexpected screen, slow interaction, or failed request closest to what the user reported. Record its time and the active route.
2. Move backward to the initiating intent
Section titled “2. Move backward to the initiating intent”Look for the preceding tap, navigation event, Redux action, or custom performance mark. Do not stop at the nearest log line merely because it is easy to read.
3. Follow explicit links before nearby events
Section titled “3. Follow explicit links before nearby events”Use request IDs, operation IDs, parent events, or action metadata when available. Fall back to time proximity only when the application has not recorded a relationship.
4. Inspect payloads at the boundary
Section titled “4. Inspect payloads at the boundary”Compare the data leaving one subsystem with the data entering the next. Useful boundaries include state-to-request, response-to-reducer, route-params-to-screen, and error-to-fallback.
5. Write one falsifiable hypothesis
Section titled “5. Write one falsifiable hypothesis”“The refresh request starts with an expired refresh token” is testable. “Authentication is flaky” is not. Use the sequence to identify the smallest claim that explains every relevant event.
6. Reproduce once with focused instrumentation
Section titled “6. Reproduce once with focused instrumentation”Add a correlation identifier, mark, or targeted log only if the existing evidence cannot distinguish between competing explanations. More telemetry should answer a question, not become a reflex.
Capture has a cost
Section titled “Capture has a cost”A unified timeline can become a junk drawer if every object is serialized without limits. Instrumentation affects performance, privacy, and readability.
I use several constraints when deciding what belongs in a debugging timeline:
- Capture development sessions by default, not production sessions.
- Redact known sensitive fields before transmission.
- Bound payload size, queue length, history, and error context.
- Exclude binary bodies and avoid invoking getters during serialization.
- Preserve the application’s original console and network behavior.
- Allow categories to be disabled when they do not help the current investigation.
These constraints are not optional polish. A debugging tool must avoid creating a second bug while observing the first one.
Redaction also has limits. Structured fields such as password, authorization, and query
parameters can be removed reliably when they are represented as fields. A secret embedded in a
free-form error message or stack string is much harder to identify safely. Application code still
has a responsibility not to put secrets there.
Why I built PulseRN around this model
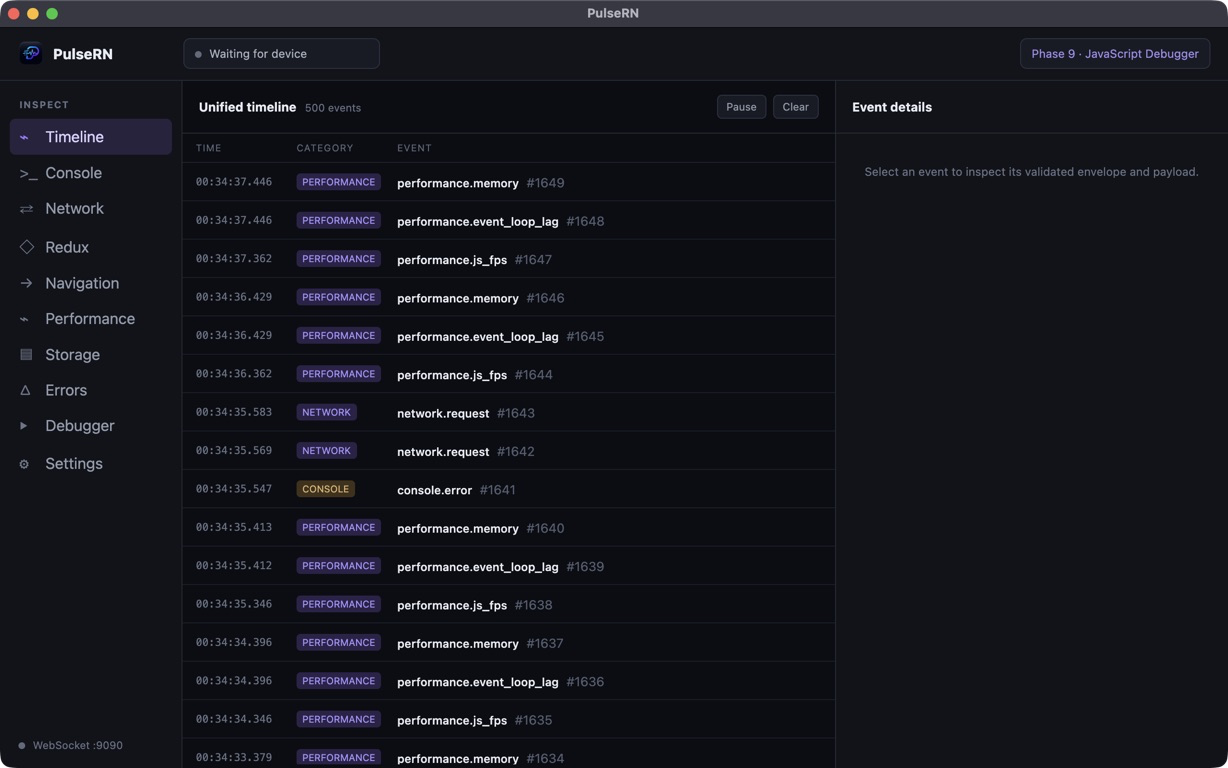
Section titled “Why I built PulseRN around this model”I built PulseRN around one chronological workspace for console, network, Redux, navigation, performance, storage, and error events. The desktop app keeps category-specific inspectors, but the timeline is the connective tissue.
The React Native SDK adds sequence and identity, applies configured redaction, batches events, and sends them to the local desktop app. PulseRN validates them before they reach the interface and stores retained history in SQLite. The live view stays bounded, while older events can be paged when an investigation needs them.
This approach does not eliminate traditional debugging. When a sequence identifies the suspicious code path, I still want Hermes breakpoints, original TypeScript sources, scopes, watches, and evaluation. The timeline tells me where the story changed; the source debugger helps me understand why that line behaved that way.
Fewer tabs, stronger explanations
Section titled “Fewer tabs, stronger explanations”The value of a timeline is not that it displays more events. Its value is that it helps me produce a better explanation.
A good debugging explanation connects intent, state, external work, and outcome. It identifies the first incorrect transition rather than the last visible error. It can be tested, fixed, and turned into a regression test.
React Native already has capable tools for individual signals. The next improvement is not another place to look. It is a way to keep the story intact while moving between them.
If that workflow sounds useful, the PulseRN getting-started guide shows how to connect a development build and confirm its first events.