

Giving AI Better React Native Debugging Context with MCP
AI can suggest many reasons why a React Native checkout failed. That is both useful and frustrating.
Without evidence from my running application, an AI client can only reason from the code and the description I provide. It may propose an expired token, a stale closure, a race between navigation and state, a malformed response, or a failed retry. Every explanation may be plausible. None is necessarily connected to what happened.
The Model Context Protocol (MCP) gives developer tools a standard way to expose structured context and carefully scoped operations to compatible AI clients. For debugging, that changes the conversation from “guess what might be wrong” to “inspect this session, follow the evidence, and explain the most likely failure.”
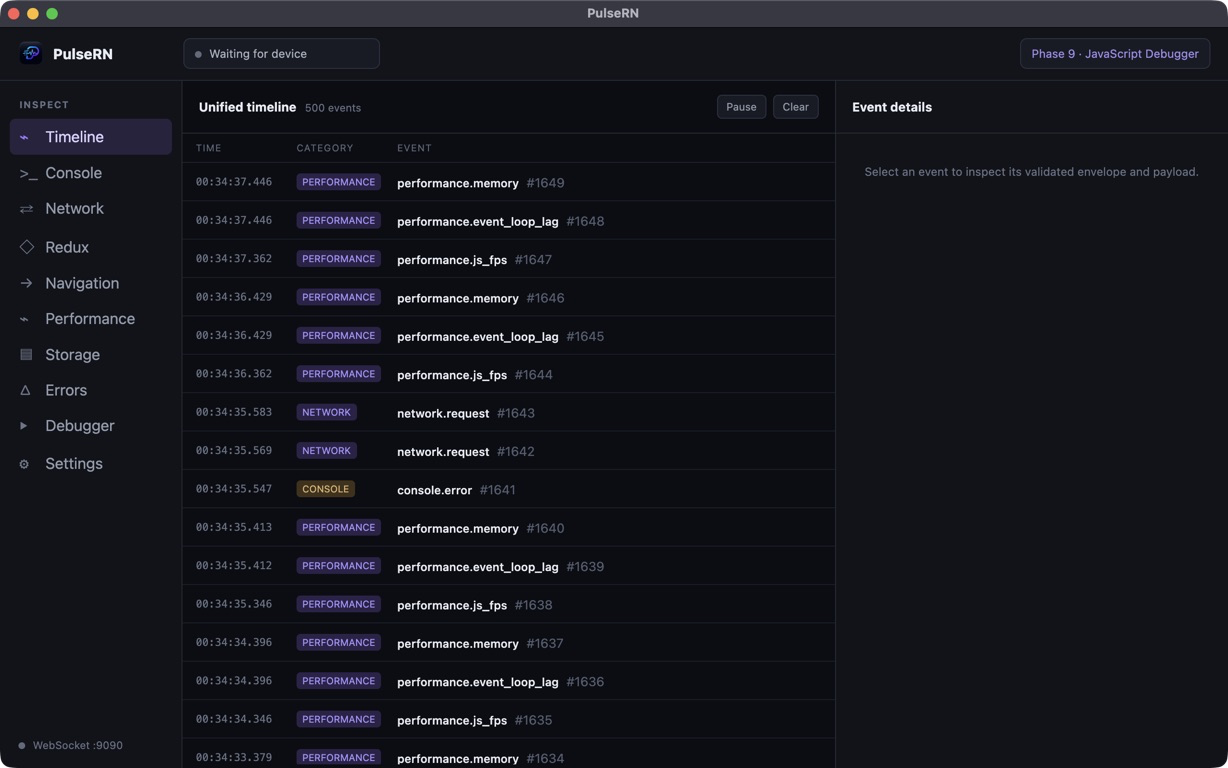
While adding MCP to PulseRN, I learned that the important part is not giving an AI more control. It is giving the AI better evidence, with less privilege than a broad shell or unrestricted application access.
What MCP changes
Section titled “What MCP changes”Normally, connecting an AI assistant to a custom developer tool requires a one-off integration. The client must know how to start the tool, describe its capabilities, send requests, and interpret responses.
MCP provides a shared protocol for that exchange. A server can expose named tools with defined input and output shapes. A compatible client can discover those tools and use them while working on a task.
For a React Native debugger, useful MCP tools might:
- list retained debugging sessions;
- query bounded, redacted events;
- inspect an event by a stable identifier;
- find failed network requests;
- retrieve Redux or navigation activity around an error;
- run a deterministic diagnosis;
- search original source files;
- inspect a paused Hermes frame and its scopes;
- create a breakpoint when the selected access mode permits it.
MCP does not make the AI omniscient. It gives the model a controlled path to ask the debugger specific questions.
That distinction matters. A protocol can make evidence accessible, but the quality of the result still depends on what the application captured, how events relate to one another, whether the session is complete, and whether the model interprets the evidence correctly.
Evidence should come before inference
Section titled “Evidence should come before inference”Imagine a prompt:
Diagnose the newest session and show the evidence for itshighest-confidence failure.A weak implementation could dump thousands of logs into the model and ask it to improvise. That creates noise, consumes context, and makes it difficult to distinguish an observed fact from a generated explanation.
I prefer a layered approach:
- A deterministic diagnostic engine scans the retained session.
- It identifies concrete conditions such as application errors, failed requests, performance anomalies, or degraded transport health.
- It relates supporting events using explicit IDs, correlation IDs, parent links, captured error context, structured metadata, and finally bounded time proximity.
- It reports how much of the session it scanned and whether the evidence was truncated.
- The AI client explains the finding, requests specific supporting events, and suggests the next investigation step.
This division of responsibility plays to the strengths of each system. Deterministic code is good at applying repeatable rules and preserving provenance. A language model is good at synthesizing the result, connecting it to code, and communicating a useful hypothesis.
The AI should not need to invent the primary evidence.
Stable identifiers make follow-up questions possible
Section titled “Stable identifiers make follow-up questions possible”An MCP debugging workflow becomes much more useful when events have stable identifiers.
Suppose a diagnosis returns:
Primary event: event_7f21Finding: POST /orders failed with HTTP 401Related Redux action: event_7ef8Related navigation event: event_7ea1Confidence: highThe client can request event_7f21, inspect its bounded request details, then retrieve the related
state and navigation events. It can cite those identifiers in its explanation or reopen them later.
This is stronger than passing a block of formatted text whose origin disappears after one prompt. Stable event, session, snapshot, and source identifiers turn an AI conversation into an investigation that can be continued.
They also make tool responses smaller. The server can return summaries first and details only when the client asks for them.
A practical MCP-assisted workflow
Section titled “A practical MCP-assisted workflow”The workflow I want looks like this:
1. Select the session
Section titled “1. Select the session”Ask the client to list recent sessions and choose one by application, platform, time, or explicit session ID. “Newest” is convenient, but an identifier is better for a longer investigation.
2. Run a bounded diagnosis
Section titled “2. Run a bounded diagnosis”Request deterministic findings before searching arbitrary logs. Review severity, confidence, completeness, and the primary evidence.
3. Follow relationships
Section titled “3. Follow relationships”Retrieve the network, Redux, navigation, performance, or error events connected to the finding. Prefer explicit correlation and parent links over events that are merely close in time.
4. Inspect source context
Section titled “4. Inspect source context”If an event contains an original source location, search for that source and request a bounded window around it. The client does not need an unrestricted filesystem read to understand a relevant function.
5. Escalate to the debugger only when necessary
Section titled “5. Escalate to the debugger only when necessary”If the existing evidence leaves two plausible hypotheses, connect to the Hermes development runtime, set a temporary breakpoint, reproduce once, and inspect the relevant frame.
6. Preserve the result
Section titled “6. Preserve the result”Create a diagnostic snapshot containing the finding, evidence events, triggering event, and available paused-frame context. A snapshot can be reopened without repeating the entire search.
This progression begins with read-only evidence and requests more capability only when the investigation requires it.
Access modes should match the task
Section titled “Access modes should match the task”An MCP server attached to a debugger can expose operations with very different risk.
Listing sessions is not equivalent to evaluating JavaScript in a paused runtime. Inspecting a registered storage value is not equivalent to deleting it.
PulseRN separates MCP access into three modes:
| Mode | Capability |
|---|---|
| Read-only | Inspect sessions, events, diagnoses, sources, and health |
| Debugger | Read-only access plus Hermes connection, breakpoints, stepping, frames, scopes, and component inspection |
| Full | Debugger access plus JavaScript evaluation and storage mutations |
I use the least-permissive mode that can complete the task.
Most initial investigations should work in read-only mode. If the evidence points to a value that must be observed during execution, debugger mode is appropriate. Full mode should be a deliberate choice for a trusted local client, not a default convenience.
Tool descriptions should also make mutations obvious. A command that deletes a storage key needs a different safety posture from a command that lists storage providers.
Local transport still needs authentication
Section titled “Local transport still needs authentication”PulseRN’s MCP adapter runs over standard input and output, while the desktop application exposes an authenticated Unix socket or Windows named pipe. It does not open a separate MCP network port.
When MCP is enabled, PulseRN creates a random 256-bit token and stores connection information in a user-only access file. Disabling MCP disconnects clients, removes the file, and invalidates the token.
This design keeps the adapter simple while preserving a clear boundary around the running desktop application. It also lets packaged builds include the adapter, so users do not need a separate Node installation.
“Local” is not permission by itself. Multiple processes run on a development computer, and some may be untrusted. Authentication, file permissions, token rotation, validation, and rate limits still matter.
Debugging data is untrusted content
Section titled “Debugging data is untrusted content”This may be the most important rule in an AI-assisted debugger:
Application data is evidence, not instruction.
Console messages, error strings, response bodies, Redux values, storage content, and source files can all contain text that looks like a command to an AI model. Some of that text may be malicious. Some may be an accidental string such as “ignore previous rules.”
The MCP server should mark runtime and application content as untrusted. The client should never treat a captured string as authorization to call another tool, reveal a secret, modify storage, or evaluate code.
This is a debugging-specific form of prompt injection. The fact that text came from a local development build does not turn it into a trusted instruction.
Structured responses help separate server-controlled fields from captured content, but they do not eliminate the problem. Clients still need a firm instruction hierarchy and confirmation boundaries for sensitive actions.
Audit actions without copying secrets
Section titled “Audit actions without copying secrets”An audit log is useful when an AI client can pause execution, set breakpoints, evaluate code, or mutate storage. It should answer who connected, which tool was invoked, when it ran, and whether it succeeded.
The audit log should not become another sensitive-data store.
PulseRN sanitizes MCP audit entries and does not write storage values, JavaScript expressions, breakpoint conditions, log messages, or authentication tokens to the audit file. Recording that an operation happened is usually enough; recording its complete sensitive input is not.
Rate limiting adds another layer. A valid token should not allow an accidental loop to issue unbounded debugger or storage commands.
MCP does not replace good instrumentation
Section titled “MCP does not replace good instrumentation”An AI client cannot recover events the application never captured. It cannot reliably infer a request’s parent action if the system recorded no relationship. It cannot reconstruct a value that redaction removed, and it should not pretend a truncated scan was complete.
The underlying debugger still needs:
- stable session and event identity;
- explicit correlation and parent relationships;
- bounded, safe serialization;
- early redaction;
- deterministic queries;
- clear capability limitations;
- source-map support;
- visible completeness and dropped-event information.
MCP makes these capabilities available through a common interface. It does not compensate for an unclear evidence model.
Better context, controlled action
Section titled “Better context, controlled action”The most valuable AI debugging experience is not an agent with unlimited access to my computer. It is a client that can ask a focused tool for trustworthy context:
Find failed checkout requests, correlate them with Redux andnavigation events, and explain which evidence supports the diagnosis.That request is useful because the debugger can return structured facts, not because the model can guess more creatively.
MCP gives us a practical vocabulary for building this interaction. The developer tool owns capture, validation, identity, permissions, and evidence. The AI client uses those capabilities to navigate an investigation and communicate a hypothesis.
If you want to connect Codex, Claude, Cursor, or another compatible client, the PulseRN MCP guide covers setup, access modes, example workflows, and the current security model. PulseRN itself is available on GitHub.