

How to Debug a Failed React Native Request as a Complete Story
A failed API request looks simple in a network inspector: method, URL, status, duration, and body. But that row is only the transport chapter of a longer application story.
The user was on a screen. Something expressed intent. State changed. Code assembled a request. A response—or the absence of one—changed state again. The interface reacted. If I look only at the red request row, I can miss the first incorrect decision.
This article describes the workflow I use to debug the complete story around a React Native request. It works with separate tools, though a chronological timeline makes the connections much easier to see.
Begin with behavior, not HTTP
Section titled “Begin with behavior, not HTTP”Imagine a checkout button that sometimes displays “Unable to place order.” The failed request might be:
POST /orders → 401 UnauthorizedIt is tempting to begin at the endpoint. Before I do that, I define the application behavior:
- Which screen was active?
- What did the user expect the tap to do?
- Was the button enabled with valid local state?
- Was another checkout already in progress?
- What did the interface show after the failure?
This matters because the same HTTP response can represent different bugs. A 401 might mean the
server rejected a valid request, the app selected an expired token, a refresh raced with checkout,
or a retry reused stale headers.
The status code narrows the search. It does not finish it.
Build the event sequence
Section titled “Build the event sequence”I first reconstruct the smallest sequence that contains the failure:
navigation.focus Checkoutredux.action cart/recalculatedredux.action checkout/submittednetwork.request POST /orders startednetwork.request POST /orders completed: 401redux.action auth/refreshRequestednetwork.request POST /token completed: timeoutredux.action checkout/rejectederror.manual Unable to place orderIf my tools are separate, I write this sequence in a scratch file and normalize timestamps. If the app records an operation ID, request ID, or correlation ID, I include it. A few minutes spent making the order explicit can prevent an hour of reading the wrong subsystem.
I also mark what is missing. For example, there is no auth/refreshSucceeded, no retry of
POST /orders, and no navigation away from Checkout. Absence is not proof, but it often suggests
the next place to instrument.
Step 1: Find the initiating intent
Section titled “Step 1: Find the initiating intent”Move backward from the request until you find the event that represents why it exists.
That may be:
- a button press;
- a Redux or Zustand action;
- a navigation transition;
- a screen lifecycle effect;
- a background timer;
- a retry policy;
- an optimistic update.
This step separates user work from incidental network traffic. Mobile applications often issue analytics, refresh, prefetch, and background synchronization requests near the same time. The nearest request is not necessarily the relevant request.
Give one operation a stable identifier when possible:
const operationId = createOperationId();
dispatch(checkoutSubmitted({ operationId }));await api.createOrder(order, { operationId });
The identifier does not need to cross the public API boundary. It can remain development metadata used by logging, state middleware, and network instrumentation.
Step 2: Inspect state at the request boundary
Section titled “Step 2: Inspect state at the request boundary”Next, compare the state that represented intent with the payload and headers actually sent.
For a checkout, I might inspect:
- cart items and calculated totals;
- selected address and currency;
- the authentication state at submission time;
- any idempotency key;
- the request body after serialization;
- headers after interceptors modify them.
Do not dump the entire store merely because it is available. Large state snapshots are noisy, slow to compare, and more likely to contain sensitive data. Capture the relevant slice or a path-based diff around the action.
The key question is: Did the correct information cross the boundary?
If state contains the current access token but the request contains an old one, the bug lives in request construction or interceptor state. If both contain the old token, move earlier to session restoration or refresh logic. If the request is correct, the server response becomes more interesting.
Step 3: Separate transport failure from application failure
Section titled “Step 3: Separate transport failure from application failure”“Network error” is too broad. Classify the outcome:
| Outcome | Evidence to inspect |
|---|---|
| HTTP response | Status, response headers, bounded text/JSON body |
| Timeout | Configured limit, elapsed time, retry behavior |
| Connection failure | Host, device route, TLS, server availability |
| Cancellation | Abort source and whether cancellation was expected |
| Parsing failure | Raw response type, content type, decoder error |
| Application rejection | Business error represented by a successful HTTP response |
React Native adds environment-specific variables. An Android emulator reaches the development computer differently from an iOS Simulator. A physical device may require authenticated LAN pairing. TLS trust can differ between device and desktop. These connection problems should not be debugged as reducer bugs.
Binary bodies should remain excluded from general capture, and large text bodies should be bounded. For most failures, method, URL, status, selected headers, timing, and a limited structured body are enough.
Step 4: Follow the failure into state
Section titled “Step 4: Follow the failure into state”The request result is not the end of the story. Find the action, callback, or query-cache update that consumes it.
Ask:
- Was the result classified correctly?
- Did retry logic run?
- Was an optimistic update rolled back?
- Did a stale response overwrite newer state?
- Did the reducer preserve a useful error code?
- Did the UI receive a domain error or only a generic string?
A frequent mistake is losing information at each layer. The server returns a specific code, the API
client turns it into Error("Request failed"), the thunk turns that into rejected, and the screen
shows “Try again.” By the time the user reports the problem, the evidence has disappeared.
Preserve structured, non-sensitive diagnostic fields such as operation, status, and domain error code. Avoid embedding credentials or complete payloads inside free-form error messages.
Step 5: Verify what the user saw
Section titled “Step 5: Verify what the user saw”Finally, connect the state result to interface behavior.
Did the button leave its loading state? Did navigation occur before the rejection? Did an error boundary replace the screen? Was the message appropriate for a recoverable timeout? Did two overlapping operations compete for the same state flag?
Navigation context is especially helpful here. A request may finish after the initiating screen has blurred or unmounted. Updating global state can then affect a different screen, making the symptom look unrelated.
For performance-sensitive bugs, add marks around the interaction:
ReactNativeDevTool.performance.mark("checkout-start");await submitCheckout();ReactNativeDevTool.performance.mark("checkout-complete");ReactNativeDevTool.performance.measure( "checkout-duration", "checkout-start", "checkout-complete",);The measurement does not explain the delay by itself. It creates a boundary that can be compared with the request, state changes, and renders inside it.
Turn the story into a hypothesis
Section titled “Turn the story into a hypothesis”After assembling the evidence, I write one sentence:
Checkout uses the access token captured when the API client was created, so the request after a successful refresh still sends the expired token.
That hypothesis explains a sequence and predicts a result. I can verify the token version at request construction, change the interceptor to read current state, and add a test covering refresh followed by checkout.
Compare that with “the API sometimes returns 401.” The second statement describes an observation but gives me no precise change to test.
Capture safely
Section titled “Capture safely”Network debugging can expose more sensitive information than almost any other category. I treat redaction as part of instrumentation design:
redaction: { fields: ["password", "otp", "token"], headers: ["authorization", "cookie"], queryParameters: ["api_key"],}Redact before data leaves the application process. Bound body sizes. Exclude binary content. Keep instrumentation development-only unless a deliberate, separately reviewed production diagnostics design exists.
Also remember what field redaction cannot guarantee. If application code places a token inside an error message, stack string, or arbitrary text body, a field-name rule cannot reliably find it.
Using PulseRN for the workflow
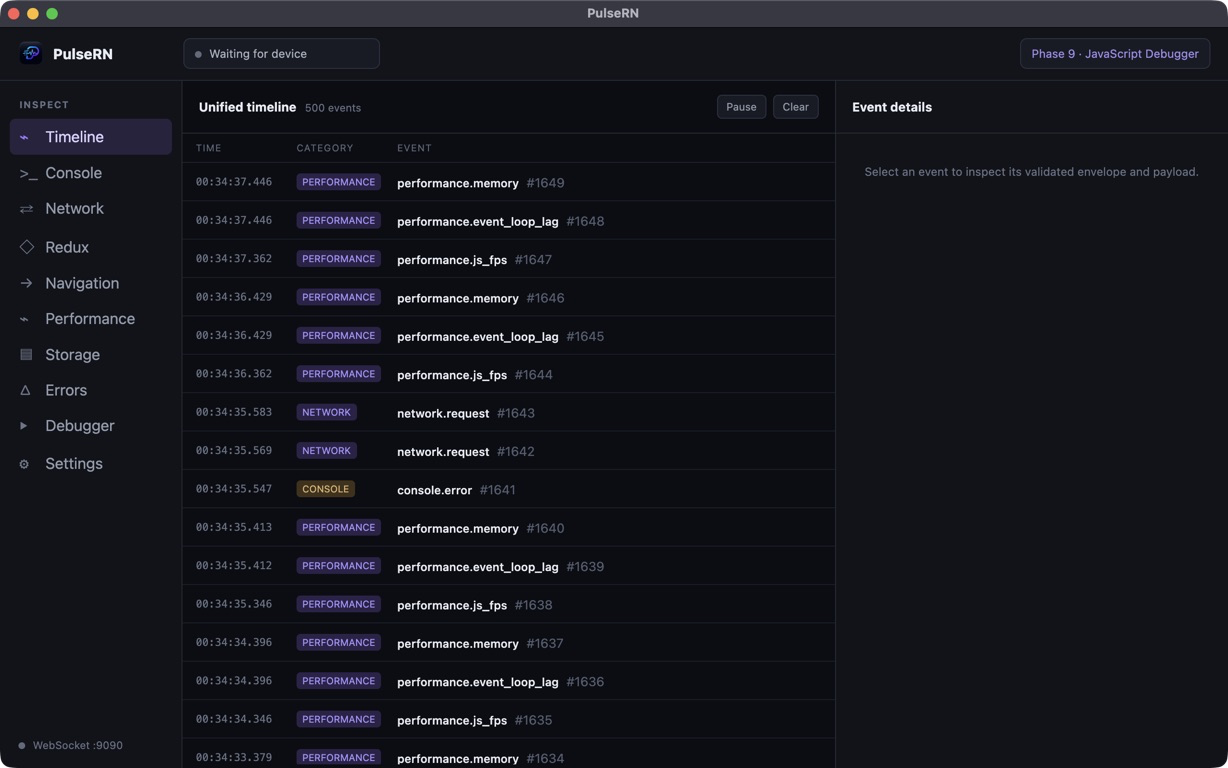
Section titled “Using PulseRN for the workflow”In PulseRN, I designed the timeline to place navigation, Redux, network, performance, console, and handled errors in one ordered view. Explicit correlation and parent relationships take priority over simple time proximity, and category inspectors expose the details of each event.
PulseRN is not required to adopt this debugging method. The method is the important part: start from behavior, move back to intent, inspect each boundary, and follow the result all the way to the user interface.
The next time a request fails, resist the urge to stare at the red row. Reconstruct the story that created it. That is usually where the fix is waiting.
The timeline and sessions guide documents how PulseRN preserves and correlates this evidence across a development run.